> For the complete documentation index, see [llms.txt](https://drshahizan.gitbook.io/eda1/llms.txt). Markdown versions of documentation pages are available by appending `.md` to page URLs; this page is available as [Markdown](https://drshahizan.gitbook.io/eda1/course-content/introduction/a-comprehensive-examination.md).
# A Comprehensive Examination
Essential Analysis Considerations in Data Analysis
Data analysis plays a vital role in extracting valuable insights from datasets. To ensure a thorough and accurate analysis, it is essential to consider various aspects. This article provides a comprehensive examination of the essential analysis considerations in data analysis. By understanding and addressing these key factors, analysts can derive meaningful and reliable insights from their data.
In the field of data analysis, the following aspects are investigated to derive meaningful insights:
## **1. Dataset's Shape and Overview**
The initial step involves examining the **shape** of the dataset, encompassing the number of **rows** and **columns**. This provides a comprehensive **overview** of the dataset's structure and composition.
## **2. Missing Values**
Identifying and addressing missing values is critical to ensuring data quality. The analysis entails determining the presence and extent of **missing values** within the dataset. This step aids in making informed decisions regarding the appropriate treatment of missing data.
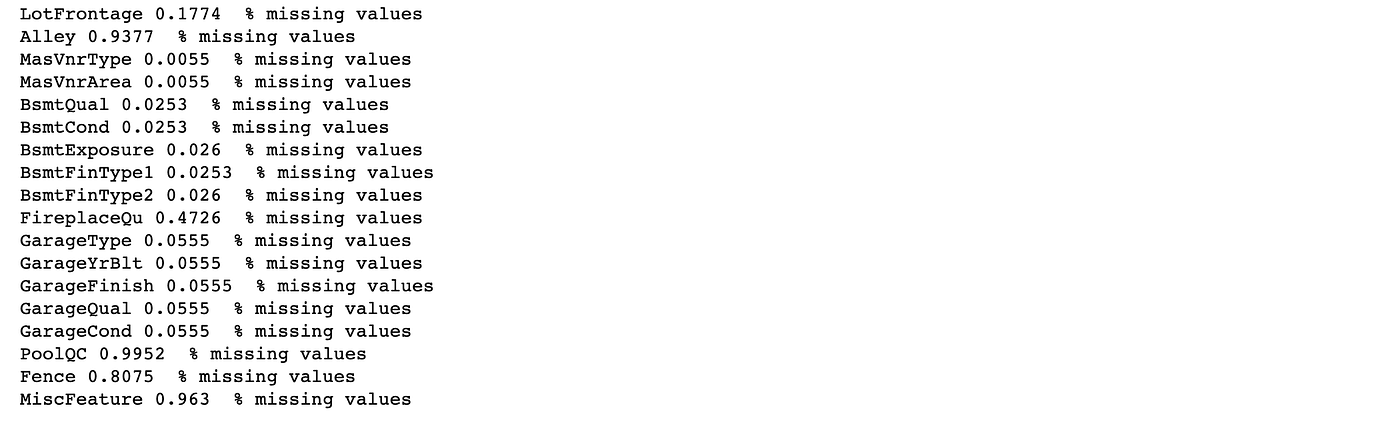
Here we will check the percentage of NaN values present in each feature:\
1\) make the list of features which has missing values\
2\) print the feature name and the percentage of missing values
We can use heatmap and visualize missing values.
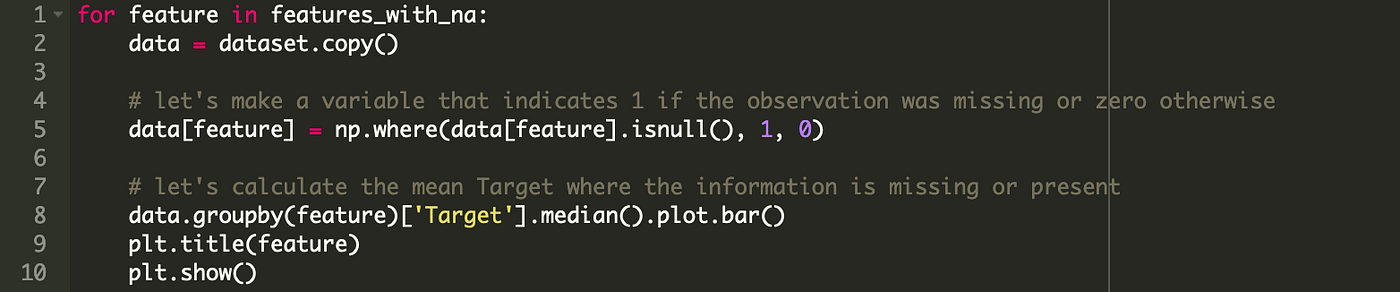
We need to find the relationship between missing values and the target feature. Let’s plot some diagram for this relationship.
Here, the relation between the missing values and the dependent variable is clearly visible. So we need to replace these NaN values with something meaningful which we will do in Feature Engineering. From the above dataset some of the features might not be required, which we will drop.
## **3. Numerical Variables**
In-depth exploration of **numerical variables** is conducted. This entails analyzing statistical characteristics such as **mean**, **median**, and **standard deviation** to gain insights into central tendency, dispersion, and variability of these variables.
Get the list of Numerical variables and visualize columns.
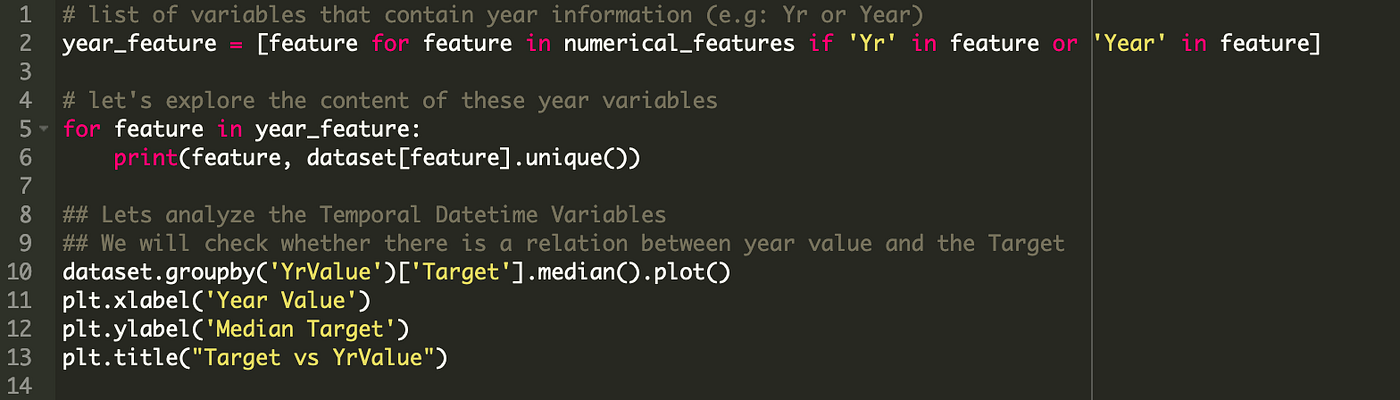
**Temporal Variables(Eg: Datetime Variables):** From a Dataset, we may have year variables. We can extract information from the datetime variables like number of years or number of days.
## **4. Distribution of Numerical Variables**
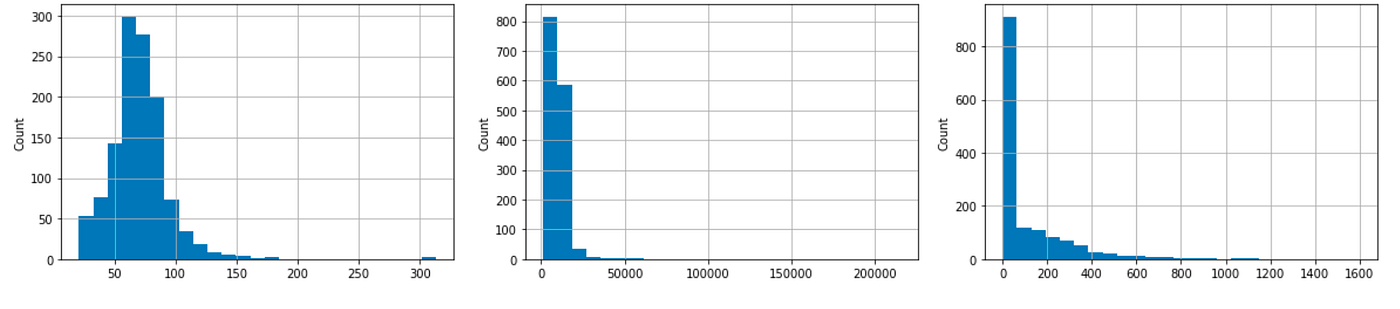
Understanding the distribution of **numerical variables** is essential for accurate data interpretation. Visualizations and statistical techniques are employed to examine the **shape**, **skewness**, and **kurtosis** of these variables.
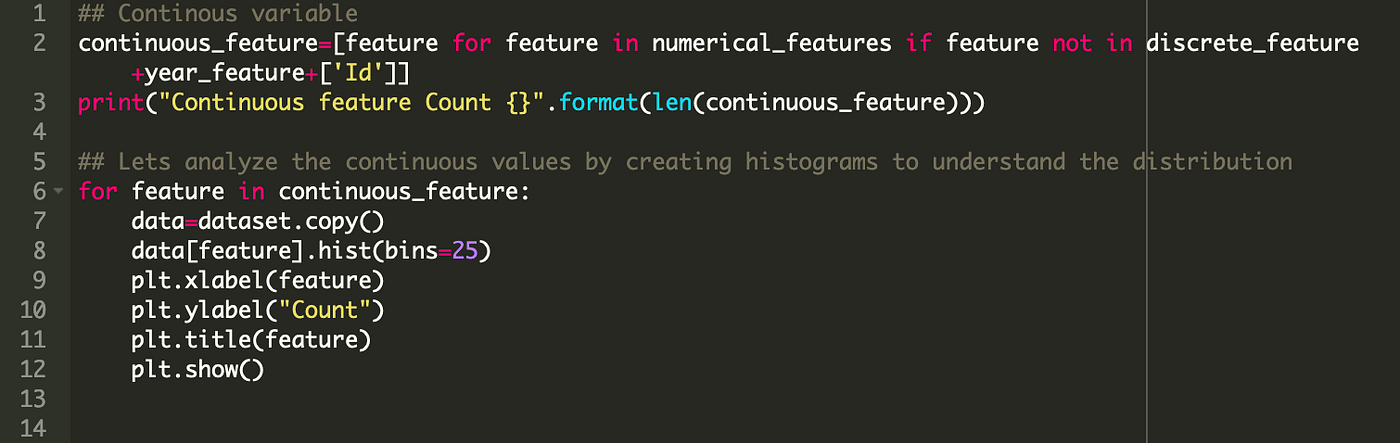
Numerical variables are usually of 2 types: Discrete Variable and Continuous variable.
## **5. Outliers**
The identification and examination of **outliers**, which are observations that significantly deviate from the majority, are essential. This analysis aids in assessing the impact of outliers on the dataset. Based on the dataset's nature, appropriate actions such as exclusion, transformation, or handling of outliers can be determined.
Let’s find outliers in continuous variables using Boxplot.
## **6. Categorical Variables**
The analysis encompasses an exploration of **categorical variables** within the dataset. This involves examining the different **categories** and their respective **frequencies** to gain insights into the composition and distribution of these variables.
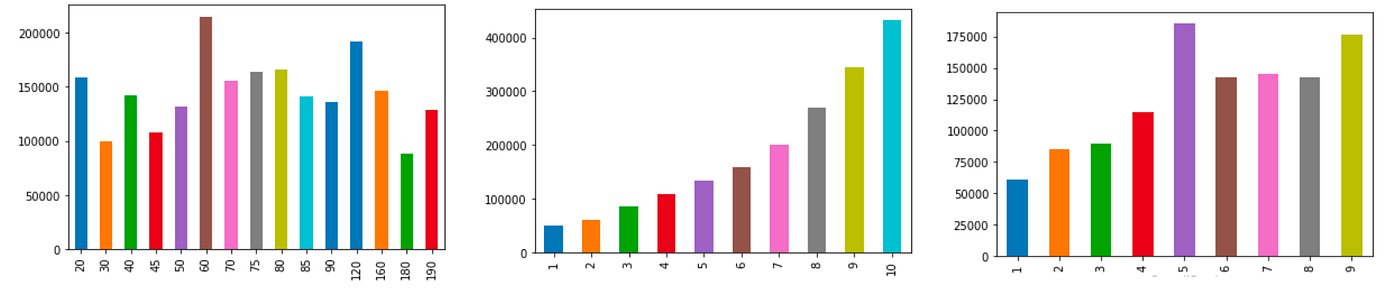
Let’s find out the relationship between categorical variable and dependent feature.
## **7. Cardinality of Categorical Variables**
Evaluating the **cardinality**, i.e., the number of unique values, within categorical variables is crucial. Assessing the level of diversity within each variable helps guide decision-making regarding variable transformation or feature engineering, if required.
## **8. Relationship Between Independent & Dependent Features**
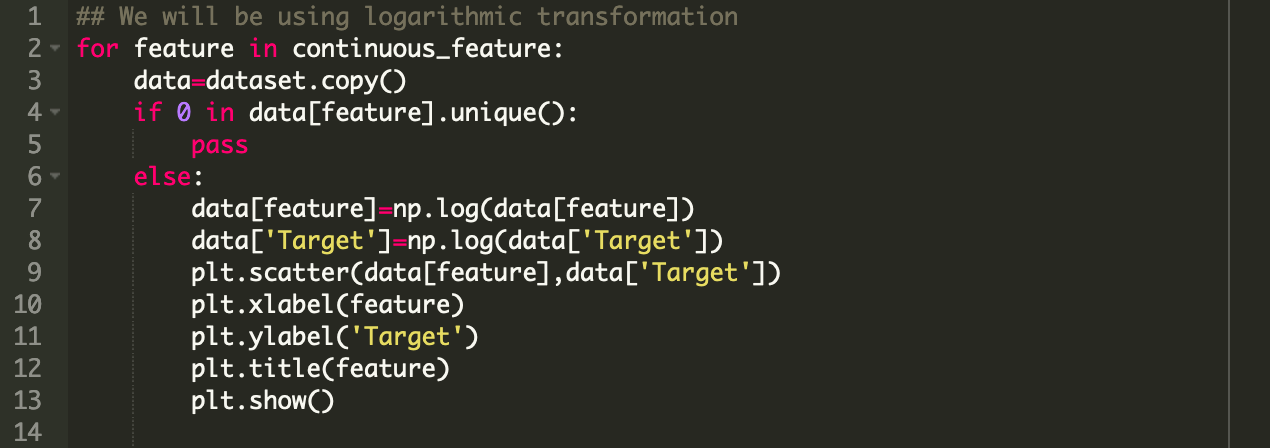
The relationship between **independent features** and the **dependent feature** of interest is scrutinized. This involves **plotting** and analyzing the distributions of independent features in relation to the dependent feature. This analysis aids in uncovering potential **patterns**, **correlations**, or **dependencies** present in the data.
By thoroughly examining these aspects, valuable insights can be gleaned, leading to informed decision-making throughout the data analysis process.
## Conclusion
A comprehensive examination of essential analysis considerations enhances the quality and reliability of data analysis. By focusing on the dataset's shape, missing values, numerical and categorical variables, distributions, outliers, and the relationship between features, analysts can derive meaningful insights and make informed decisions. Considering these factors ensures robust analysis and enables data-driven decision-making.
[](https://visitorbadge.io/status?path=https%3A%2F%2Fgithub.com%2Fdrshahizan)