📊Matplotlib
A plotting library for creating visualizations
Matplotlib is a popular Python library for creating visualizations. It provides a wide range of functions and tools for creating various types of plots, charts, and graphs, making it an excellent choice for performing EDA. Matplotlib is a comprehensive library for creating static, animated, and interactive visualizations in Python. Matplotlib makes easy things easy and hard things possible.
Create publication quality plots.
Make interactive figures that can zoom, pan, update.
Customize visual style and layout.
Export to many file formats.
Embed in JupyterLab and Graphical User Interfaces.
Use a rich array of third-party packages built on Matplotlib.
Matplotlib is an amazing visualization library in Python for 2D plots of arrays. Matplotlib is a multi-platform data visualization library built on NumPy arrays and designed to work with the broader SciPy stack. It was introduced by John Hunter in the year 2002. One of the greatest benefits of visualization is that it allows us visual access to huge amounts of data in easily digestible visuals.
Common techniques in EDA using Matplotlib:
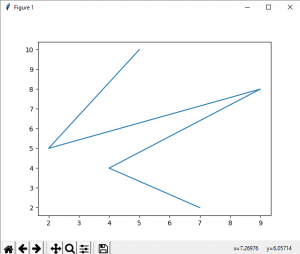
Line Plots: Line plots are used to visualize the trend and patterns in data over time or any continuous variable. Matplotlib provides functions like
plot()andshow()to create and display line plots.Bar Plots: Bar plots are useful for displaying and comparing categorical data. Matplotlib's
bar()andbarh()functions allow you to create vertical and horizontal bar plots, respectively.Histograms: Histograms display the distribution of a numerical variable by dividing it into bins and showing the frequency of values within each bin. The
hist()function in Matplotlib can be used to create histograms.Scatter Plots: Scatter plots are effective for visualizing the relationship between two numerical variables. Matplotlib's
scatter()function can be used to create scatter plots, and you can add additional features such as colors, sizes, or labels to represent additional dimensions.Box Plots: Box plots, also known as box-and-whisker plots, summarize the distribution of a numerical variable, including its median, quartiles, and any outliers. Matplotlib's
boxplot()function is commonly used to create box plots.Heatmaps: Heatmaps are useful for visualizing the correlation between variables in a dataset. Matplotlib's
imshow()orpcolor()functions can be used to create heatmaps, and you can enhance them by adding color bars or annotations.Pie Charts: Pie charts are helpful for displaying the proportions of different categories in a dataset. Matplotlib's
pie()function can be used to create pie charts, and you can customize the colors, labels, and other properties as needed.
These are just a few examples of the wide range of visualizations you can create using Matplotlib for EDA. Matplotlib provides extensive customization options, allowing you to create visually appealing and informative plots to explore and understand your data effectively.
Installation
Windows, Linux and macOS distributions have matplotlib and most of its dependencies as wheel packages. Run the following command to install matplotlib package :
Basic plots in Matplotlib
Matplotlib comes with a wide variety of plots. Plots helps to understand trends, patterns, and to make correlations. They’re typically instruments for reasoning about quantitative information. Some of the sample plots are covered here.
Output
Last updated